Using MetaCost and Naive Bayes together for Prediction
 Contributor I
I have been working on a prediction model for customer churn. My attributes are polynomial, integers and the label is binomial. I have nested the operators as such:
X-Validation -> MetaCost -> Naive Bayes
I've been getting good results, so I want to make sure that this nesting process is valid. Does anyone have any experience with this type of model?
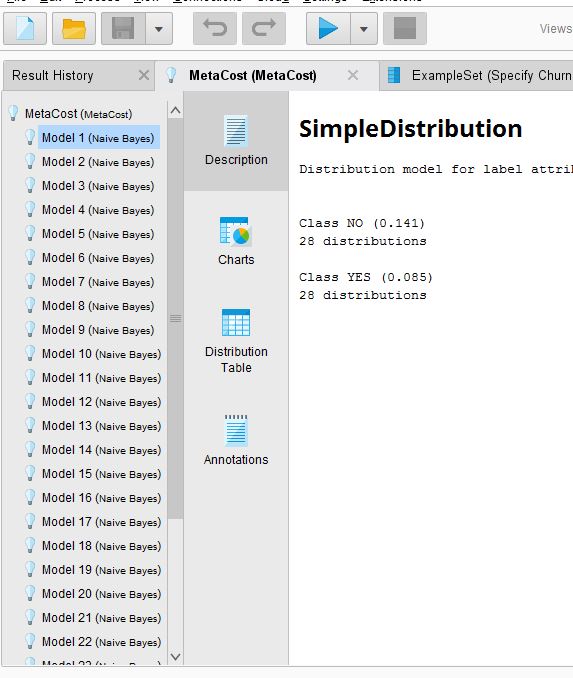
Additionally, when I view my results, I see my performance vector tab, my example set tab and my metacost tab. The metacost tab shows the following results. If my model is valid, I would like to view which attributes most heaviliy contributed to the correct prediciton, but I'm not sure how to do it. Can anyone help with either of these? I've searched both this forum and the documentation, as well as YouTube.


Answers
Hi Spinningblue,
There are a few operators that should do the trick here. If you wanted to add a selection layer to this you can embed your Naive bayes inside of a Foreward Selection operator. this will add an extra step into your model generation(i.e. increase runtime) but as you are using a NB that shouldn't be a problem. What it will do though is select only the attributes wihich most contribute to the prediction and keep those once its generated a model. You can also look at similar operators like PCA(Princple Component Analysis) I would recommend this if you have many dimension if you are at less than 20 foreward selection should do the trick. If you are fine with your current attributes you can also us a few of the Weight By operators after the model generation. Weight by Correlation or stratification if I'm not mistaken should do the trick. Hope this helps!
Thanks for your response. I believe that I have a good model, but what I need now is to be able to explain which factors led to such a good prediction - for example, which attributes contributed the most to customer churn according to my prediction model. Perhaps I am not experienced enough with reading the results pane. Is there somewhere in the results that I should be able to view that information? Such as a graph or chart?