The Altair Community is migrating to a new platform to provide a better experience for you. In preparation for the migration, the Altair Community is on read-only mode from October 28 - November 6, 2024. Technical support via cases will continue to work as is. For any urgent requests from Students/Faculty members, please submit the form linked here
Time Series & Prediction Label Value Range
Following the tutorials from 2010, "Rapidminer 5.0 Video Tutorial #10 - Financial Time Series Modeling" from Thomas Ott,
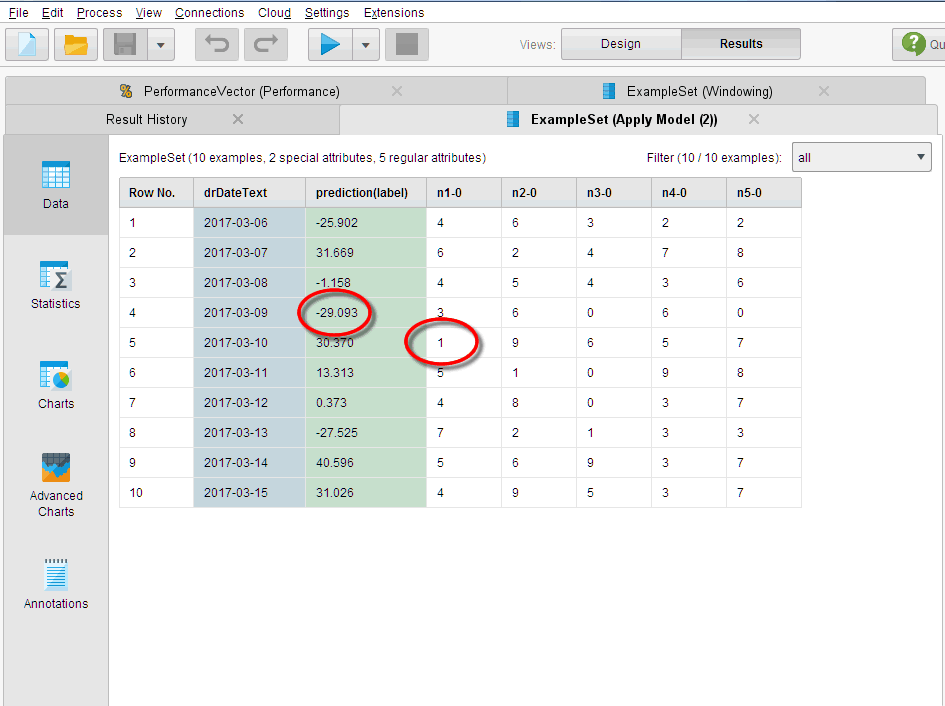
I get prediction labels in the format '31.000' etc., while my actual label values are between 0 and 9 (see below).
What's going on here? Is it because of my RM-Version, or did I made an unforced mistake?
Who can help?
PS:
Label = n1
My out of sample data are the last 10 of a bigger sample (youngest).
My inner sample data is of the rest of the data (historically earlier).

PS: Are there any new videos- related to time series available/found?
Tagged:
0

 Maven
Maven
Answers
I'm not sure what your process looks like and what algorithm you are using but if you remember from my tutorials that point forecasting was not as robust as trend forecasting in RapidMiner. If you want to do get point forecasts I suggest using the forecast library and R and wrapping it inside RapidMiner.
There is one updated written tutorial in Vijay and Bala's book, I think Chapter 10.
Thank you for the response Thomas,
Actually I want to predict directions but I'm wondering about the value ranges in the forecast.
Can you confirm that I made no significant mistake and that this is still the right way to do so?
Here is my process (Attachment)....
I see that you're using an SVM with a dot kernel. What is this time series? Production units? Sales? The application of the SVM, it's kernel, C value, and gamma can have a dramatic effect on the forecasting the direction of your time series (see attached). Without knowing the data, it almost looks like a GLM would work better but I would check.
Hello T-Bone, thank you for the response.
I see the C-parameter of the SVM operator but no gamma. How did you produced the image 'C vs gamma'
The data is real live data (see attachment).
If I had 100 datasets could I use 90 of them as inner sample data and 10 of the 100 as outer sample/validation data?
Should the validation data be younger then the training data?
Thank you for the advices.
Ah yes, the gamma parameter becomes available once you change the kernel from dot to anything else. So I changed it to an RBF kernel, which tends to perform better in time series. I also took your process and then created a parameter optimization scheme on it. Once the C and gamma changed, the results started to come into line.
With respect to your question on using a Cross or Split Validation, you could try those operators but then you lose the dependency of the time series.
Note: I don;t know how powerful your machine is but the more parameters you choose to optimize will increase the run time.
Thank you very very much Thomas.
It's wonderful. I'm speechless.
A few questions remain.
If I understand it right, I now can take the best performing C- and gamma parameters from the log, rewire the setup and use them "hard coded" to get the best predictions for the complete dataset in a shorter time. Is this right?
A prediction for an up-to-date tomorrow data is represented in the last row of the result. Is this right?
With respect to your first question, yes. The optimized values of C and gamma can now be used in your process. Just put them into the parameters and run your process again. This time faster.
With respect to your last question, yes you should expect the value to be lower. When using Windowing and setting your Label column, you will shift back your label value in time and use the window to predict the value for the current window. It's a bit confusing but for a refresheer check out this Community thread: http://community.rapidminer.com/t5/RapidMiner-Studio/Time-Series-using-Windowing-operator-in-RapidMiner/m-p/31791
In cases like this I usually convert the label to Down or Up values using the Classify by Trend operator. Good luck!
Thank you Thomas,
Currently I have no idea how to use the Classify by Trend Operator.
But since I will write to Excel I can classify via VBA.
Are there any usefull features to determine overfitting in RM?
In this case, what do you think perfomance wise about SVM versus Recurrent Neural Networks?
I tried RNN a little bit in TensorFlow (with no success, still learning).
PS: I tried to give you thumb up, but my browser fails at that point.