Heating a Vermont house with Pi and Pellets Part 3: Getting data from NOAA
 sgenzer
Administrator, Moderator, Employee-RapidMiner, RapidMiner Certified Analyst, Community Manager, Member, University Professor, PM Moderator Posts: 2,959
 Greetings Community,
It has been three weeks since my last blog entry about "Pi and Pellets". Why so long? It's very simple: it's been too warm to burn any pellets! We were up over 80°F / 27°C last week - hardly the weather to turn on extra heat. Fortunately it has turned cool again with nature agreeing with the season change. The leaves are changing finally and the wild turkey have decided to forage before winter.

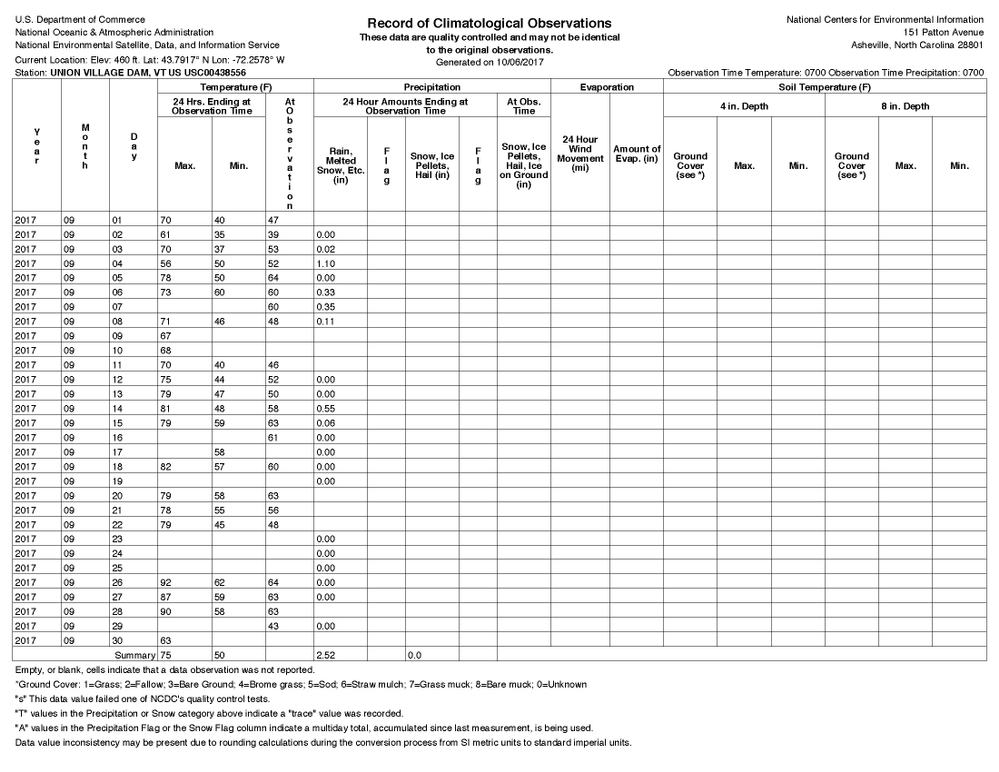
During this no-burn-pellets time, I decided to enrich my data set with outside weather data. I have a strong hunch that my optimized model is going to depend, at the very least, on outside temperature. In the U.S., the National Weather Service provides a literal mountain of data to the public on their website, and even better, via a wide array of webservices. All you need to do is get an access token, find the nearest weather station to you, and get the data. If only it were that simple! To make a LONG story shorter, I eventually was able to find my nearest NOAA weather station (Union Village Dam, Thetford, VT), its station ID number (USC00438556) and the dataset that it provides (Global Historical Climatology Network – Daily, abbreviated CHCND. See here for more info.). What's even more interesting is that the data collection is not consistent. You get different data depending on the day...no idea why. Here's a PDF export for the month of September 2017:

So then it's only a question of querying the webservice (one day at a time, for ease of parsing the various data) in JSON format, converting to XML (because RapidMiner does not have a good JSON array parser - yet), and storing the data. But there is a problem: this is only daily min and max temperatures! I want hourly temperatures at the very least.

How to convert these min/max values to approximate hourly values? Well I know it's approximately sinusoidal with an almost perfect sinusoid at the vernal/autumnal equinoxes and nowhere near that at the summer/spring solstices. I don't need a perfect hourly temperature, but as I am at latitude 43°, I need to take this into account a bit. After a quick review of some math and a lot of googling, I found a nice paper that allows me to roughly convert daily max/min temperatures to hourly temperatures.

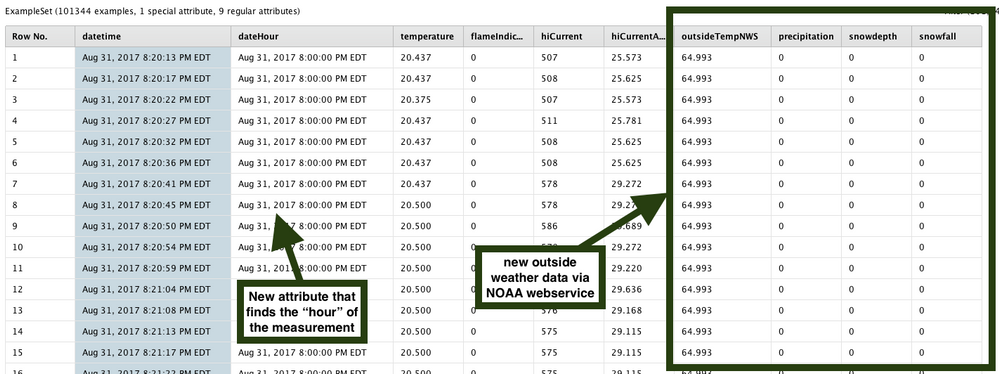
And then finally I can join this information to my piSensor data table for future use:

I am attaching the process as an .rmp file to this post as the xml is rather long. Some interesting RapidMiner Studio pieces if you are interested...
- I had to use a cURL statement in an Execute Program operator, rather than the usual Enrich Data via Webservice operator (in the Web Mining extension). For lack of a more updated operator, I sometimes need to resort to shell commands.
- I needed to recreate the "CIBSE Guide" from 1982 that is shown in the paper, sharing the typical times of day for max/min temperature as a function of the month of the year.
- You will see a huge mess in Generate Attributes (14). This is my implementation of the formula shown in the paper. There are probably more elegant ways to do this, but I needed to do it myself in order to understand the math involved.
- You will see that I needed to extract the "count" given in the NOAA webservice metadata. This is because of the issue explained above where there are different data depending on the day (goodness knows why). I then use "Select Subprocess" depending on the count to extract the respective attributes. I could do this nicer by extracting the datatype...just did not feel like it!
That's about it for this blog post. Hope you are enjoying the journey!

