"SVM model results : display bug in charts ?"
 lionelderkrikor
RapidMiner Certified Analyst, Member Posts: 1,195
  Unicorn
Hi,
I'm doing some experimentations in Rapidminer and it seems that I discovered a bug :
I created a simply model using the "SVM" operator.
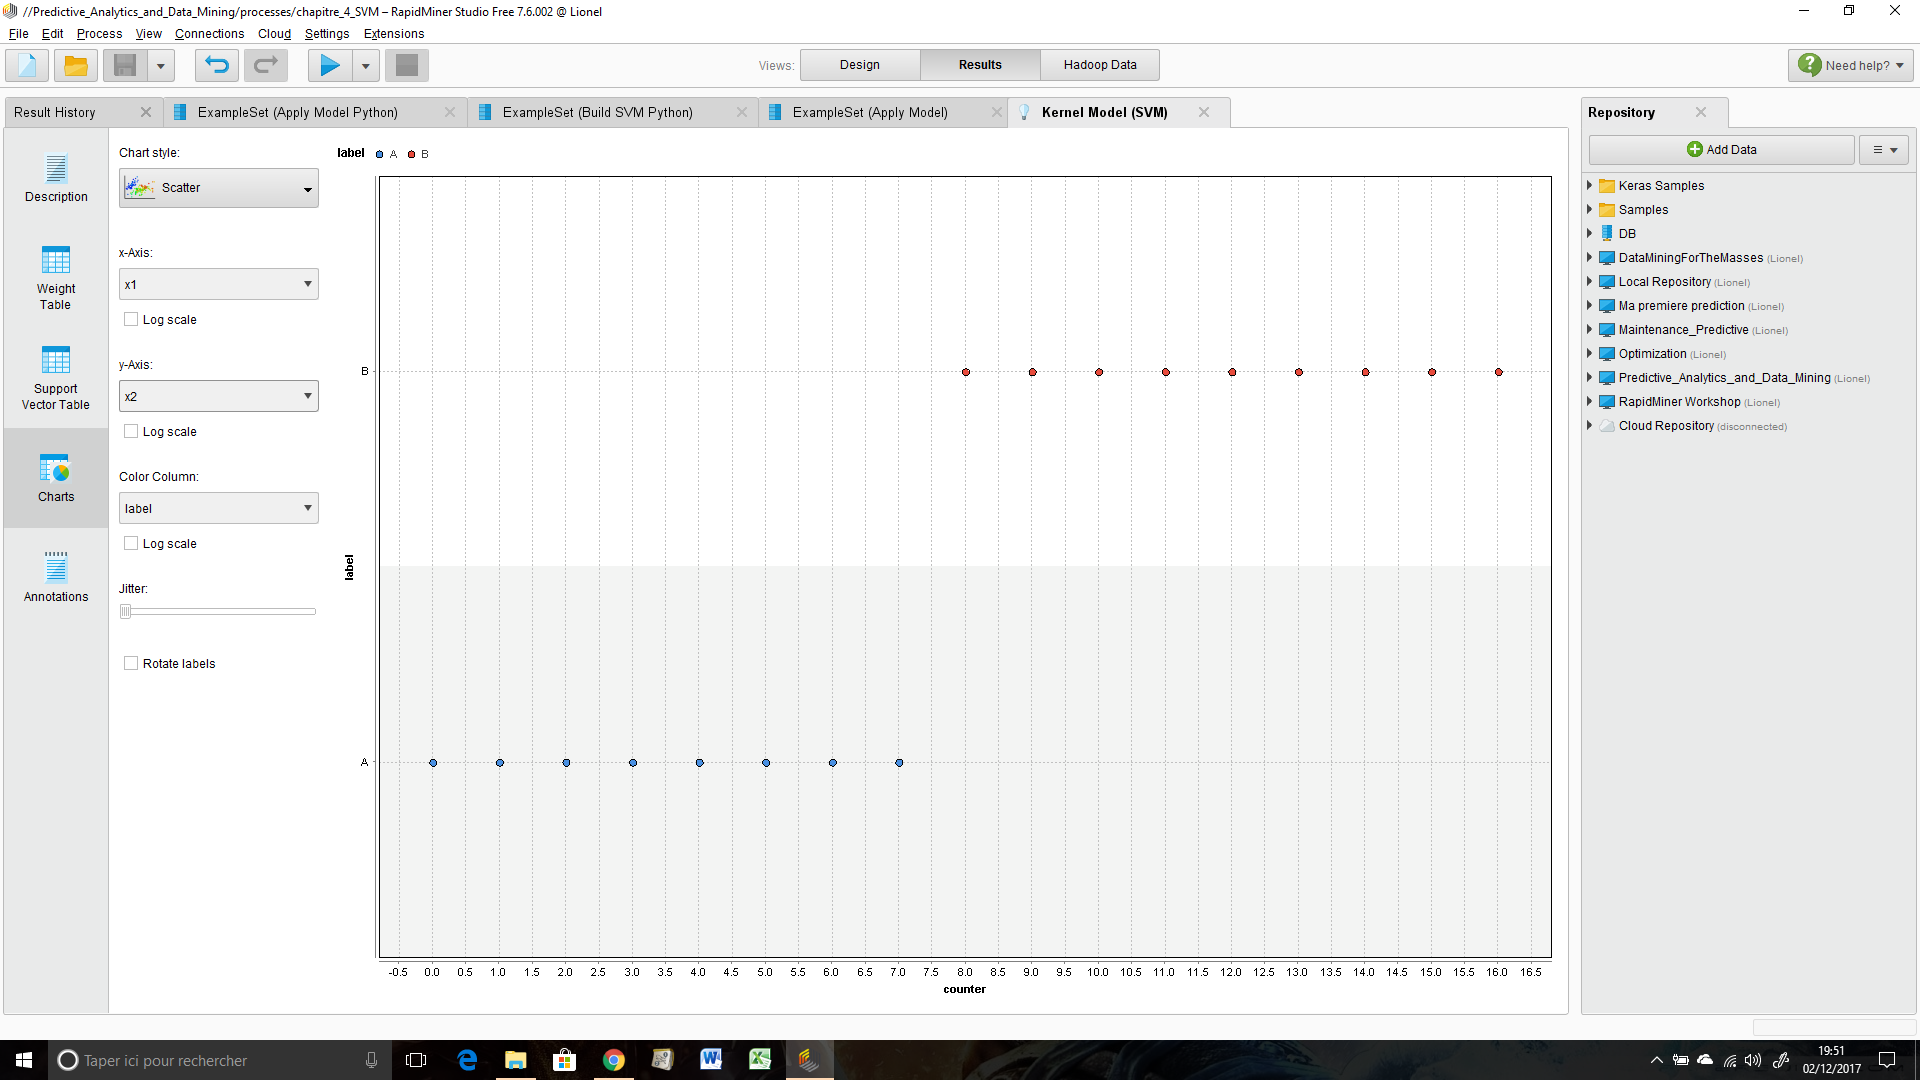
I run the process and I'm going to the results windows -> "Kernel Model (SVM) -> Charts :
Then I choose chart style = "Scatter" (but maybe some other chart styles are concerned by this bug) : It's impossible to display x1 (my first attribute) on x-axis and x2 (my second attribute) on y-axis and vice-versa.
Here a screenshot of the charts window :

The other physical quantities (counter, label, function value etc.) are good displayed.
My training dataset (04_Class_4.6_SVM_simple_example.csv) and my score dataset (score_test_SVM.csv)
are in attached files.
You can find my process here :
<?xml version="1.0" encoding="UTF-8"?><process version="7.6.002">
<context>
<input/>
<output/>
<macros/>
</context>
<operator activated="true" class="process" compatibility="7.6.002" expanded="true" name="Process">
<process expanded="true">
<operator activated="true" class="read_csv" compatibility="7.6.002" expanded="true" height="68" name="Read_TrainSet" width="90" x="45" y="85">
<parameter key="csv_file" value="C:\Users\Lionel\Documents\Formations_DataScience\Rapidminer\Predictive_Analytics_and_Data_Mining\Dec 15 2014\04_Class_4.6_SVM_simple_example.csv"/>
<parameter key="column_separators" value="\s+"/>
<list key="annotations"/>
<list key="data_set_meta_data_information"/>
</operator>
<operator activated="true" class="set_role" compatibility="7.6.002" expanded="true" height="82" name="Set Role" width="90" x="179" y="34">
<parameter key="attribute_name" value="class"/>
<parameter key="target_role" value="label"/>
<list key="set_additional_roles"/>
</operator>
<operator activated="true" class="support_vector_machine" compatibility="7.6.002" expanded="true" height="124" name="SVM" width="90" x="313" y="34">
<parameter key="kernel_type" value="polynomial"/>
<parameter key="kernel_degree" value="1.0"/>
<parameter key="C" value="1.0"/>
<parameter key="convergence_epsilon" value="1.0E-5"/>
<parameter key="max_iterations" value="10000000"/>
<parameter key="scale" value="false"/>
</operator>
<operator activated="false" class="python_scripting:execute_python" compatibility="7.4.000" expanded="true" height="82" name="Read_TrainSet (2)" width="90" x="45" y="340">
<parameter key="script" value="import pandas as pd # rm_main is a mandatory function, # the number of arguments has to be the number of input ports (can be none) def rm_main(): path = 'C:\Users\Lionel\Documents\Formations_DataScience\Rapidminer\Predictive_Analytics_and_Data_Mining\Dec 15 2014' data = pd.read_csv(path + '/04_Class_4.6_SVM_simple_example.csv',sep ='\s+') # connect 2 output ports to see the results return data"/>
</operator>
<operator activated="false" class="python_scripting:execute_python" compatibility="7.4.000" expanded="true" height="103" name="Build SVM Python" width="90" x="179" y="340">
<parameter key="script" value="import pandas as pd import numpy as np from sklearn.svm import SVC from sklearn.calibration import CalibratedClassifierCV # rm_main is a mandatory function, # the number of arguments has to be the number of input ports (can be none) def rm_main(train): X = train.iloc[:,0:2] y = train.iloc[:,2] x1 = train.iloc[:,0] x2 = train.iloc[:,1] model = SVC(kernel = 'linear', probability = True,degree = 1,tol = 1e-5,random_state = 1992 ) #model_calibre = CalibratedClassifierCV(model) model_calibre = CalibratedClassifierCV(model,method = 'isotonic') model.fit(X,y) model_calibre.fit(X,y) [[w1,w2]] = model.coef_ [w0] = model.intercept_ support = model.support_ [dual_coef] = model.dual_coef_ decfunction = model.decision_function(X) support = pd.DataFrame(data =support,columns = ['support']) alpha= pd.DataFrame(data = dual_coef,columns = ['alpha']) abs_alpha = pd.DataFrame(data = np.absolute(dual_coef),columns = ['abs(alpha)']) alpha = alpha.join(abs_alpha,how = 'left') alpha = alpha.join(support,how = 'left') alpha = alpha.set_index('support') dec_func = pd.DataFrame(data = decfunction,columns = ['decision function']) dec_func = dec_func.join(y) dec_func = dec_func.join([x1,x2],how = 'outer') dec_func =pd.concat([dec_func,alpha], axis = 1) weight = pd.DataFrame(data = [[w0,w1,w2]],columns = ['w0','w1','w2']) weight = pd.concat([weight,dec_func]) #weight.rm_metadata['w0']=(None,'w0') #weight.rm_metadata['w1']=(None,'w1') #weight.rm_metadata['w2']=(None,'w2') #weight.rm_metadata['decision function']=(None,'decision function') #weight.rm_metadata['label']=(None,'label') # connect 2 output ports to see the results return weight,model,model_calibre"/>
</operator>
<operator activated="true" class="read_csv" compatibility="7.6.002" expanded="true" height="68" name="Read_ScoreSet" width="90" x="313" y="187">
<parameter key="csv_file" value="C:\Users\Lionel\Documents\Formations_DataScience\Rapidminer\Predictive_Analytics_and_Data_Mining\Dec 15 2014\score_test_SVM.csv"/>
<parameter key="column_separators" value="\s+"/>
<list key="annotations"/>
<list key="data_set_meta_data_information"/>
</operator>
<operator activated="true" class="apply_model" compatibility="7.6.002" expanded="true" height="82" name="Apply Model" width="90" x="447" y="136">
<list key="application_parameters"/>
</operator>
<operator activated="false" class="python_scripting:execute_python" compatibility="7.4.000" expanded="true" height="82" name="Read_ScoreSet (2)" width="90" x="179" y="493">
<parameter key="script" value="import pandas as pd # rm_main is a mandatory function, # the number of arguments has to be the number of input ports (can be none) def rm_main(): path = 'C:\Users\Lionel\Documents\Formations_DataScience\Rapidminer\Predictive_Analytics_and_Data_Mining\Dec 15 2014' data = pd.read_csv(path + '/score_test_SVM.csv',sep ='\s+') # connect 2 output ports to see the results return data"/>
</operator>
<operator activated="false" class="python_scripting:execute_python" compatibility="7.4.000" expanded="true" height="124" name="Apply Model Python" width="90" x="447" y="391">
<parameter key="script" value="import pandas as pd from sklearn.svm import SVC # rm_main is a mandatory function, # the number of arguments has to be the number of input ports (can be none) def rm_main(model,score, model_calibre): X = score.iloc[:,0:2] pred = model.predict(X) #conf = model.predict_proba(X) conf = model_calibre.predict_proba(X) dec_function = model.decision_function(X) score['prediction (class)'] = pred score['confidence(A)'] = conf[:,0] score['confidence(B)'] = conf[:,1] score['decision function'] = dec_function score.rm_metadata['prediction (class)']=(None,'prediction (class)') score.rm_metadata['confidence(A)']=(None,'confidence(A)') score.rm_metadata['confidence(B)']=(None,'confidence(B)') score.rm_metadata['decision function']=(None,'decision function') # connect 2 output ports to see the results return score"/>
</operator>
<connect from_op="Read_TrainSet" from_port="output" to_op="Set Role" to_port="example set input"/>
<connect from_op="Set Role" from_port="example set output" to_op="SVM" to_port="training set"/>
<connect from_op="SVM" from_port="model" to_op="Apply Model" to_port="model"/>
<connect from_op="Read_TrainSet (2)" from_port="output 1" to_op="Build SVM Python" to_port="input 1"/>
<connect from_op="Build SVM Python" from_port="output 1" to_op="Apply Model Python" to_port="input 1"/>
<connect from_op="Build SVM Python" from_port="output 2" to_op="Apply Model Python" to_port="input 3"/>
<connect from_op="Read_ScoreSet" from_port="output" to_op="Apply Model" to_port="unlabelled data"/>
<connect from_op="Apply Model" from_port="labelled data" to_port="result 2"/>
<connect from_op="Apply Model" from_port="model" to_port="result 1"/>
<connect from_op="Read_ScoreSet (2)" from_port="output 1" to_op="Apply Model Python" to_port="input 2"/>
<portSpacing port="source_input 1" spacing="0"/>
<portSpacing port="sink_result 1" spacing="0"/>
<portSpacing port="sink_result 2" spacing="0"/>
<portSpacing port="sink_result 3" spacing="0"/>
<portSpacing port="sink_result 4" spacing="0"/>
<portSpacing port="sink_result 5" spacing="0"/>
</process>
</operator>
</process>
Thanks you for your explanations,
Regards,
Lionel


Comments
bug in scatter plot function confirmed. Pushing to dev team.
SG
fixed and scheduled for release.