Need help for building a process based on historical data
 Learner III
Hi,
I'm kind of new here and would like to learn something from rapidminer.
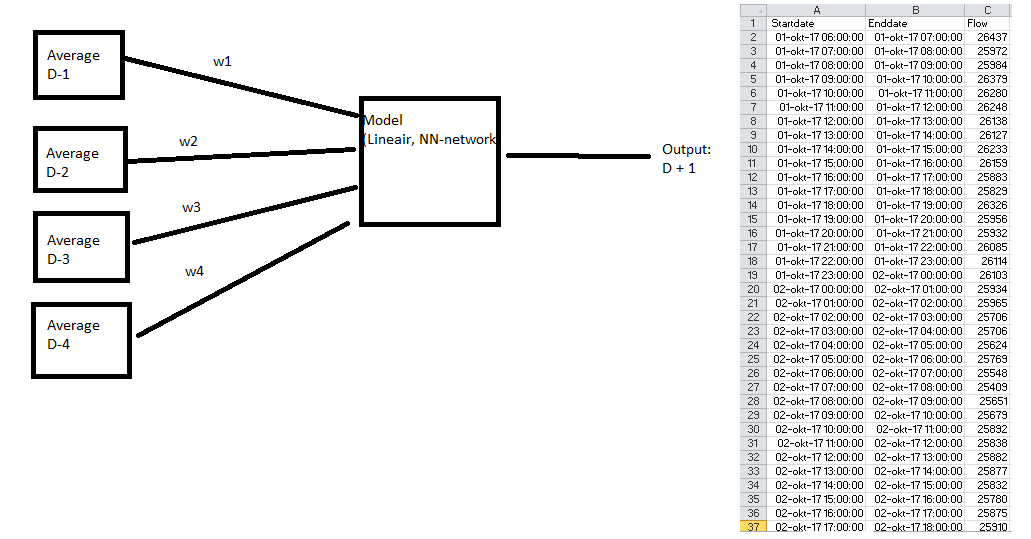
I do have built my own process in paint and I would like to copy this into rapid miner with some operators. Below you could find my process:

Let me explain the basic idea:
The dataset contains a one-hour time interval of days, so a starttime and a endtime. As third column we do have the flow of gasoil. Now the goal is to find the gasoil of tomorrow based on the days before today (in my case it is 4 days, but it might be 7 or 10 or just 3, depends of the weights). With this as input I have to built something like a model which give my a output with an flow of tomorrow. This could ofcourse be tested on all my historical data. So for example The flow of 1 okt + 2 okt + 3 okt + 3 oktober --> 5 oktober.
In my opinion you will get a general weight of each D-1, D-2,D-3 ("today minus 1 day" , "today minus 2 days" etc.) in general. And you will put this into a model, could be linear or NN-network and there will be an output.
Is this realistic to built in Rapid Miner, please give me advice because I'm new and I really don't know how to start with rapid miner. Ofcourse you could sent me a private message for insights in my data.
Last question about my dataset: As you can see my dataset contains of 3 columns. The rows are the hours of the day. Do I have to preprocess my excel file such that I could work with days like my example or does RM do have something like an operater where you could split this automatically. Below I've draw an image. 
So left my input and right the different "blocks" that I would like to make such that you have a certain time window. It might also be something like 6 or 8 or 12 hours blocks, depending on the outcomes. Does RM have an operator to split this and also could combine this in my final process which you can see in my first image.
Please let me know if you do have a solution for this case. Excuse me for my english!
With kind regards,
Maurits Freriks


Answers
You are describing the function of the windowing operator. It splits the series into 1-day, 2-day, 3-day, etc.
Here's a nice article explaining how the operator functions. Once you have your dataset windowed you can apply the NN algorithms as you desire.
http://www.simafore.com/blog/bid/106430/Using-RapidMiner-for-time-series-forecasting-in-cost-modeling-1-of-2
I'd also recommend using the Sliding Window Validation operator because this will give your model more accurate results (it tests your model on past data and tests on future data).
Thanks for the link! This was really helpfull.
In the article they talk about: "As usual, the second window of the nesting is used for "Apply Model" and "Performance (Forecasting)". An initial run with a Neural Net gives us about 80% prediction trend accuracy." With the performance operator I though I will receive accuracy aswell, but they only give me a root_mean_square_error. How do I get the accuracy, this is probably the most important result of my model to check if the model is right.
To answer more complex question, could I easily share my design somewhere?
Hi,
Thanks for sharing the XML process!
From previous posts in this chain, I understand that it is a forecasting/regression type of modeling. Since you are trying to build a regression model (i.e forecast continuous attribute) the criteria to criteria model performance would be Root mean square error, absolute error, rather than Accuracy measures which are applicable to classification models.
Also, could you share the sample data sets here; so that I can run the process on my end and see if it is possible to generate accuracy matrix?
Here is an article explaining in depth on model evaluation criteria. Hope this helps, let me know any further questions here.
https://www.analyticsvidhya.com/blog/2016/02/7-important-model-evaluation-error-metrics/
Cheers,