The Altair Community is migrating to a new platform to provide a better experience for you. In preparation for the migration, the Altair Community is on read-only mode from October 28 - November 6, 2024. Technical support via cases will continue to work as is. For any urgent requests from Students/Faculty members, please submit the form linked here
Markov Chain (transition matrix to displaying probability)
 Contributor I
Hi everyone,
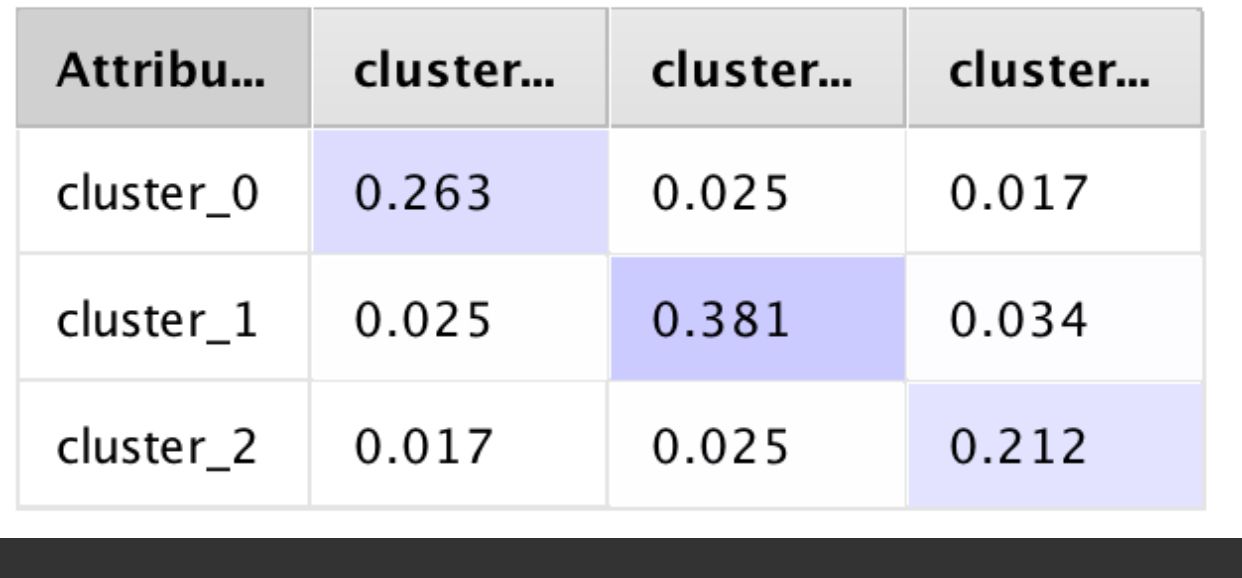
could you please help in how to create a Markov chain where each cluster will correspond to one state of the Markov chain and to compute the transition probabilities for the chain.
and how can i get these results.
Tagged:
0


Answers
Do you have a time dimension in your data? Transition probabilities usually relate to changes from one period to another, but clustering is typically done independent of time. Perhaps you can post a data sample to clarify? RapidMiner doesn't have a built-in Markov chain operator but it could be constructed manually.
Lindon Ventures
Data Science Consulting from Certified RapidMiner Experts