
"Interpreting Lift Charts"
 Contributor I
Hi,
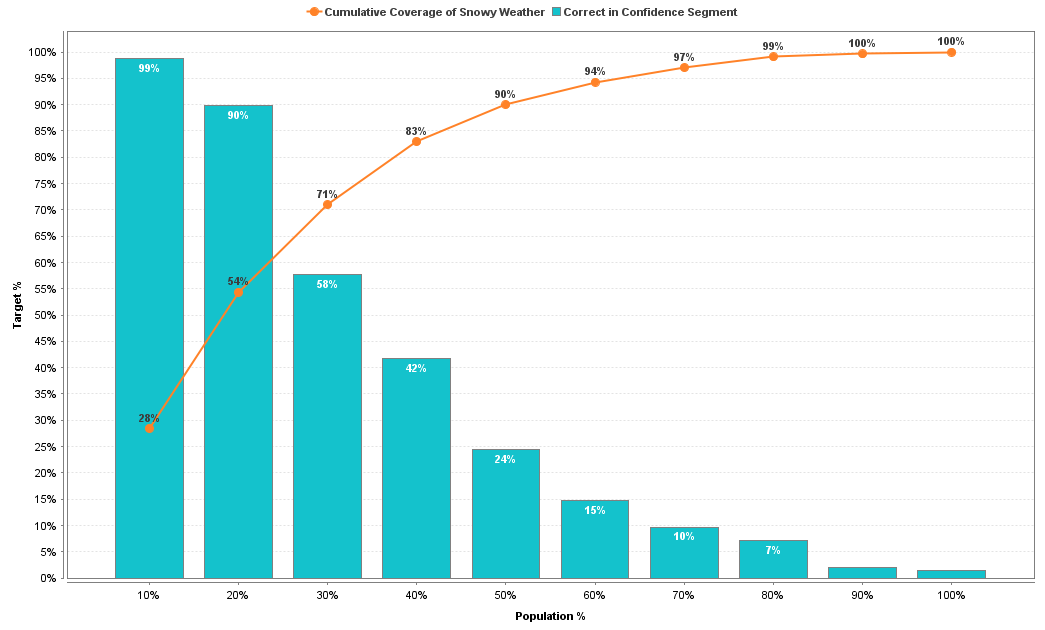
I used the Auto-model to predict a weather (snow) using five suggested different models. One of the outputs for each model was the Lift chart which I cannot interpret. I have five different lift charts I need first to understand the chart and then to find a way in comparing them.
For that, firstly, I need a help in how to interpret this chart, what the axes mean, what each point on the cumulative coverage of weather mean? and what is the correct confidence segments mean?
Secondly, if I have many Lift charts due to using of different models, how can I compare between them?
Thanks for your help.
Best Answer
-
 IngoRM
Employee-RapidMiner, RapidMiner Certified Analyst, RapidMiner Certified Expert, Community Manager, RMResearcher, Member, University Professor Posts: 1,751
IngoRM
Employee-RapidMiner, RapidMiner Certified Analyst, RapidMiner Certified Expert, Community Manager, RMResearcher, Member, University Professor Posts: 1,751  RM Founder
Hi,
For the understanding of the chart, I would recommend to read the following links:
RapidMiner docs: https://docs.rapidminer.com/latest/studio/operators/validation/visual/lift_chart.html
External docs:
http://www2.cs.uregina.ca/~dbd/cs831/notes/lift_chart/lift_chart.html
https://www.listendata.com/2014/08/excel-template-gain-and-lift-charts.html
Please notice that some people use "gain charts" instead of lift charts. But the concepts are the same.
Let me add some specific interpretation sentences for your particular chart. Maybe that saves you some reading:
"The model is doing a good job in detecting the class 'Snowy Weather'. If you look into the predictions for all our unseen test cases and sort them according to the confidence for 'Snowy Weather', most of the snow days have indeed been covered when the model was more sure that it will snow. For example, 71% of all snow days have been covered by the top 30% cases where the model was most sure it will snow."
The last sentence above also makes clear why lift / gain charts are in particular useful for marketing campaigns. Here it would read "we only send our campaign to the top 30% of our leads and got 71% of all possible responses. This saved us 70% of costs for almost the same outcome!"
The second question is actually easier to answer: typically you prefer models where the orange curve is further to the top left. But the final choice might depend on different costs for classification errors.
Hope that helps,
Ingo
3

Answers
Thanks for your great help.