The Altair Community is migrating to a new platform to provide a better experience for you. In preparation for the migration, the Altair Community is on read-only mode from October 28 - November 6, 2024. Technical support via cases will continue to work as is. For any urgent requests from Students/Faculty members, please submit the form linked here
Consulting required: Transformation or other model?
Hello everyone,
I am examining a dataset of some sales records. According to the Literature in this Field, there are some delayed effects of pricechanges.
To be more specific, the theory says: If Prices are high(er), consumers are more likely to wait and shift there purchasing actions into the future.
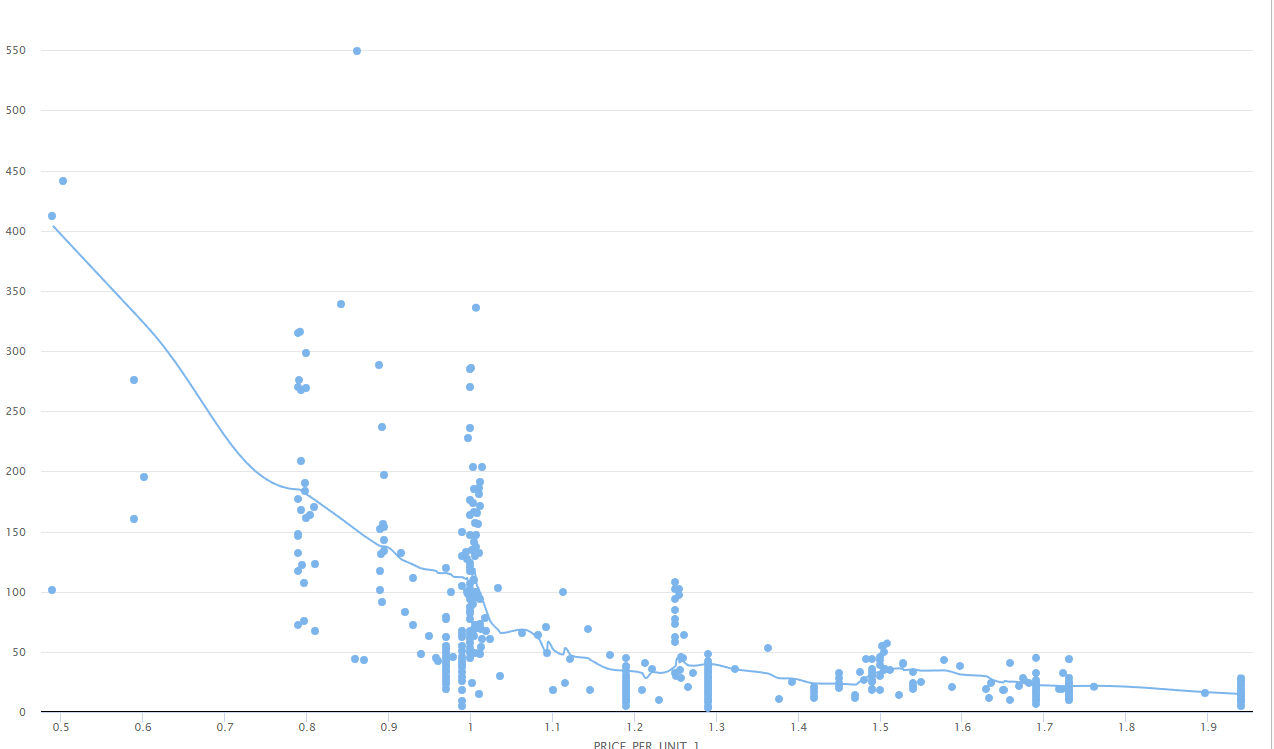
Therefore, I calculated the Price of the previous week for every row in the dataset. Following the theory, I would expect a positive sign for the coefficient "price previous week (-->X-axis) ; (Units --> Y-axis)" in a regression model and therefore, a rising regression Line

As you can see in the graph , I am not even close to such results.
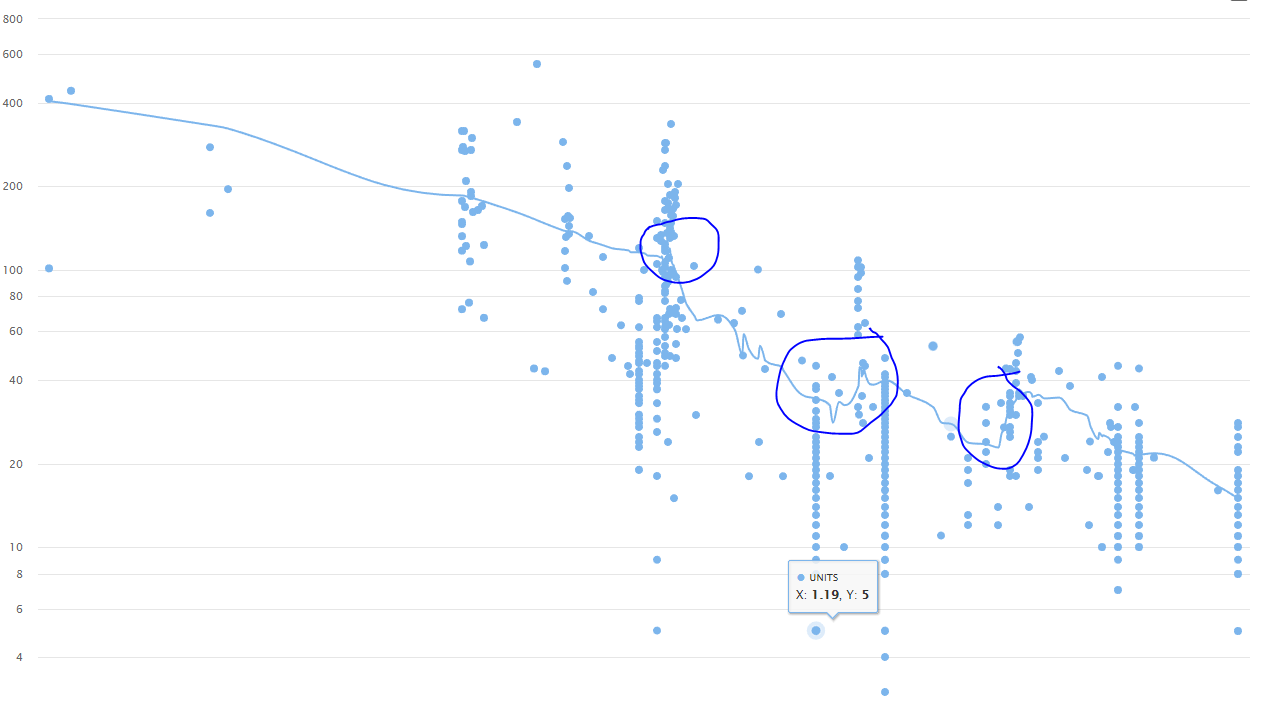
I then thought, It would be a good Idea to transform the data and applied logarithms on both factors with the following result :

Do you have an Idea for how I could transform the data so that I can confirm the theory from the literature?
I am examining a dataset of some sales records. According to the Literature in this Field, there are some delayed effects of pricechanges.
To be more specific, the theory says: If Prices are high(er), consumers are more likely to wait and shift there purchasing actions into the future.
Therefore, I calculated the Price of the previous week for every row in the dataset. Following the theory, I would expect a positive sign for the coefficient "price previous week (-->X-axis) ; (Units --> Y-axis)" in a regression model and therefore, a rising regression Line

As you can see in the graph , I am not even close to such results.
I then thought, It would be a good Idea to transform the data and applied logarithms on both factors with the following result :

I can now see the effect, but only in parts of the whole plot. In a calculation for the whole dataset, there are still negativ signs.
Now to my actual questions:
Now to my actual questions:
Do you have an Idea for how I could transform the data so that I can confirm the theory from the literature?
Or is there even a better model for that than regression?
Please excuse the long text and have a great day
1

 Guru
Guru

Answers
thank you very much for taking care.
Actually, you can close that question. I worked around this issue.
Best Regards
Happy RapidMining!
Scott