The Altair Community is migrating to a new platform to provide a better experience for you. In preparation for the migration, the Altair Community is on read-only mode from October 28 - November 6, 2024. Technical support via cases will continue to work as is. For any urgent requests from Students/Faculty members, please submit the form linked here
what kind of algoritmh Should I use?
Hi,
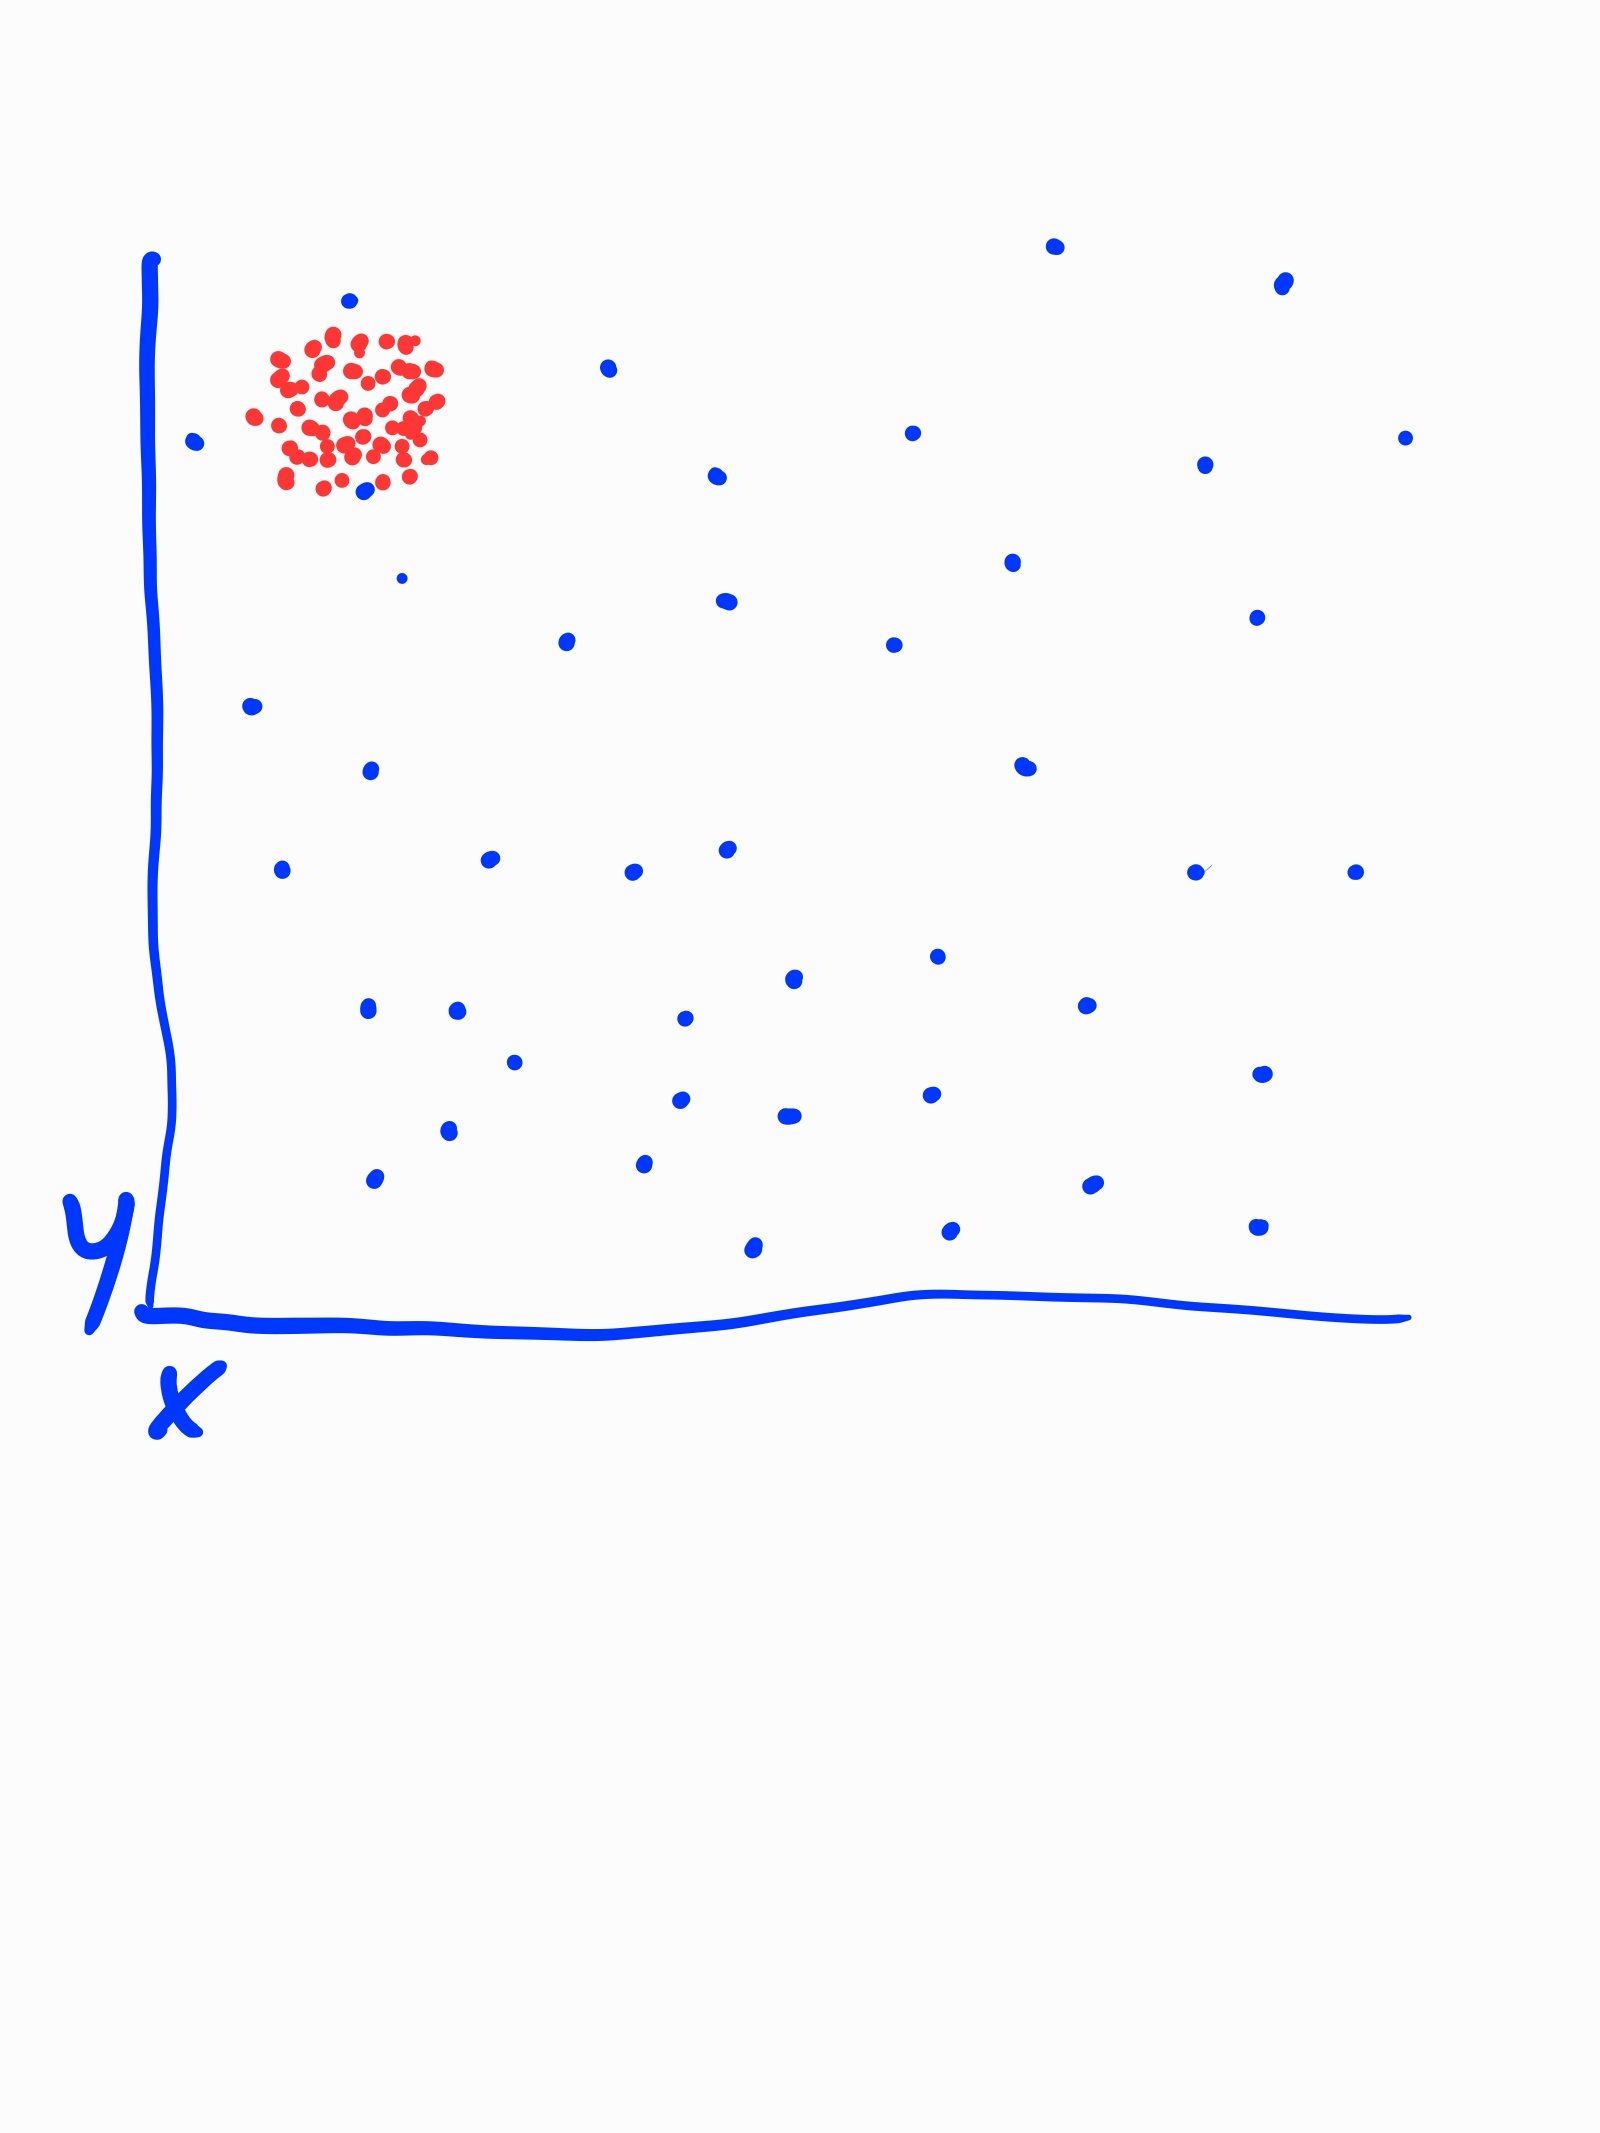
I have a dataset in wich I would like to detect a cluster, like the red dots in the attached simplified picture. I tried cluster analysis, outliers analysis by using several operators (lof, k-means, x-means, decision tree etc.) and even the auto model, but It seem I am not able to understand if I am on the right path and above all I don't know if the operators I chose are the right one. Might anybody help? 

0

 Learner I
Comments
this looks like the textbook example of a distance-based outlier detection. Check out the Anomaly Detection extension on the Marketplace, and Detect Outlier (LOF) included in Studio. Try to apply the appropriate algorithm on your data, play with parameters, and visualize the results.
If this fails: try the Cross Distances operator and analyze the numerical distances between the elements. Try to find thresholds like "X neighbors inside a distance of Y" that describe the clusters the way you need them.
Regards,
Balázs
so can you use the LOF results? For example with Generate Attributes to create the Cluster attribute (outlier == 0)?
If the example set is only just one attribute, you could aggregate by that attribute value and count the results. Then you could sort by the count descending and keep the top N classes, or remove classes having less than N examples.
Regards,
Balázs
Dortmund, Germany
Anyway, i've reproduced your data set and used a KNN global anomaly score on it. The outlier score seperates the gaussian cluster and the random noise very well:
Attached is the process
<context>
<input/>
<output/>
<macros/>
</context>
<operator activated="true" class="process" compatibility="9.8.000" expanded="true" name="Process">
<parameter key="logverbosity" value="init"/>
<parameter key="random_seed" value="2001"/>
<parameter key="send_mail" value="never"/>
<parameter key="notification_email" value=""/>
<parameter key="process_duration_for_mail" value="30"/>
<parameter key="encoding" value="SYSTEM"/>
<process expanded="true">
<operator activated="true" class="generate_data" compatibility="9.8.000" expanded="true" height="68" name="Generate Data" width="90" x="45" y="34">
<parameter key="target_function" value="random"/>
<parameter key="number_examples" value="50"/>
<parameter key="number_of_attributes" value="2"/>
<parameter key="attributes_lower_bound" value="-10.0"/>
<parameter key="attributes_upper_bound" value="10.0"/>
<parameter key="gaussian_standard_deviation" value="10.0"/>
<parameter key="largest_radius" value="10.0"/>
<parameter key="use_local_random_seed" value="false"/>
<parameter key="local_random_seed" value="1992"/>
<parameter key="datamanagement" value="double_array"/>
<parameter key="data_management" value="auto"/>
</operator>
<operator activated="true" class="generate_attributes" compatibility="9.8.000" expanded="true" height="82" name="Generate Attributes" width="90" x="179" y="34">
<list key="function_descriptions">
<parameter key="label" value=""random""/>
</list>
<parameter key="keep_all" value="true"/>
</operator>
<operator activated="true" class="generate_data" compatibility="9.8.000" expanded="true" height="68" name="Generate Data (2)" width="90" x="45" y="136">
<parameter key="target_function" value="single gaussian cluster"/>
<parameter key="number_examples" value="1000"/>
<parameter key="number_of_attributes" value="2"/>
<parameter key="attributes_lower_bound" value="-10.0"/>
<parameter key="attributes_upper_bound" value="10.0"/>
<parameter key="gaussian_standard_deviation" value="0.5"/>
<parameter key="largest_radius" value="10.0"/>
<parameter key="use_local_random_seed" value="false"/>
<parameter key="local_random_seed" value="1992"/>
<parameter key="datamanagement" value="double_array"/>
<parameter key="data_management" value="auto"/>
</operator>
<operator activated="true" class="generate_attributes" compatibility="9.8.000" expanded="true" height="82" name="Generate Attributes (2)" width="90" x="179" y="136">
<list key="function_descriptions">
<parameter key="label" value=""gaussian""/>
<parameter key="att1" value="att1-5"/>
<parameter key="att2" value="att2+3"/>
</list>
<parameter key="keep_all" value="true"/>
</operator>
<operator activated="true" class="append" compatibility="9.8.000" expanded="true" height="103" name="Append" width="90" x="380" y="34">
<parameter key="datamanagement" value="double_array"/>
<parameter key="data_management" value="auto"/>
<parameter key="merge_type" value="all"/>
</operator>
<operator activated="true" class="anomalydetection:k-NN Global Anomaly Score" compatibility="2.4.001" expanded="true" height="103" name="k-NN Global Anomaly Score" width="90" x="581" y="34">
<parameter key="k" value="10"/>
<parameter key="use k-th neighbor distance only (no average)" value="false"/>
<parameter key="measure_types" value="MixedMeasures"/>
<parameter key="mixed_measure" value="MixedEuclideanDistance"/>
<parameter key="nominal_measure" value="NominalDistance"/>
<parameter key="numerical_measure" value="EuclideanDistance"/>
<parameter key="divergence" value="GeneralizedIDivergence"/>
<parameter key="kernel_type" value="radial"/>
<parameter key="kernel_gamma" value="1.0"/>
<parameter key="kernel_sigma1" value="1.0"/>
<parameter key="kernel_sigma2" value="0.0"/>
<parameter key="kernel_sigma3" value="2.0"/>
<parameter key="kernel_degree" value="3.0"/>
<parameter key="kernel_shift" value="1.0"/>
<parameter key="kernel_a" value="1.0"/>
<parameter key="kernel_b" value="0.0"/>
<parameter key="parallelize evaluation process" value="false"/>
<parameter key="number of threads" value="8"/>
</operator>
<connect from_op="Generate Data" from_port="output" to_op="Generate Attributes" to_port="example set input"/>
<connect from_op="Generate Attributes" from_port="example set output" to_op="Append" to_port="example set 1"/>
<connect from_op="Generate Data (2)" from_port="output" to_op="Generate Attributes (2)" to_port="example set input"/>
<connect from_op="Generate Attributes (2)" from_port="example set output" to_op="Append" to_port="example set 2"/>
<connect from_op="Append" from_port="merged set" to_op="k-NN Global Anomaly Score" to_port="example set"/>
<connect from_op="k-NN Global Anomaly Score" from_port="example set" to_port="result 1"/>
<portSpacing port="source_input 1" spacing="0"/>
<portSpacing port="sink_result 1" spacing="0"/>
<portSpacing port="sink_result 2" spacing="0"/>
</process>
</operator>
</process>
Dortmund, Germany
Dortmund, Germany