The Altair Community is migrating to a new platform to provide a better experience for you. In preparation for the migration, the Altair Community is on read-only mode from October 28 - November 6, 2024. Technical support via cases will continue to work as is. For any urgent requests from Students/Faculty members, please submit the form linked here
Market basket analysis, create association rules, results
This is my online retail data set with 100,000 examples.

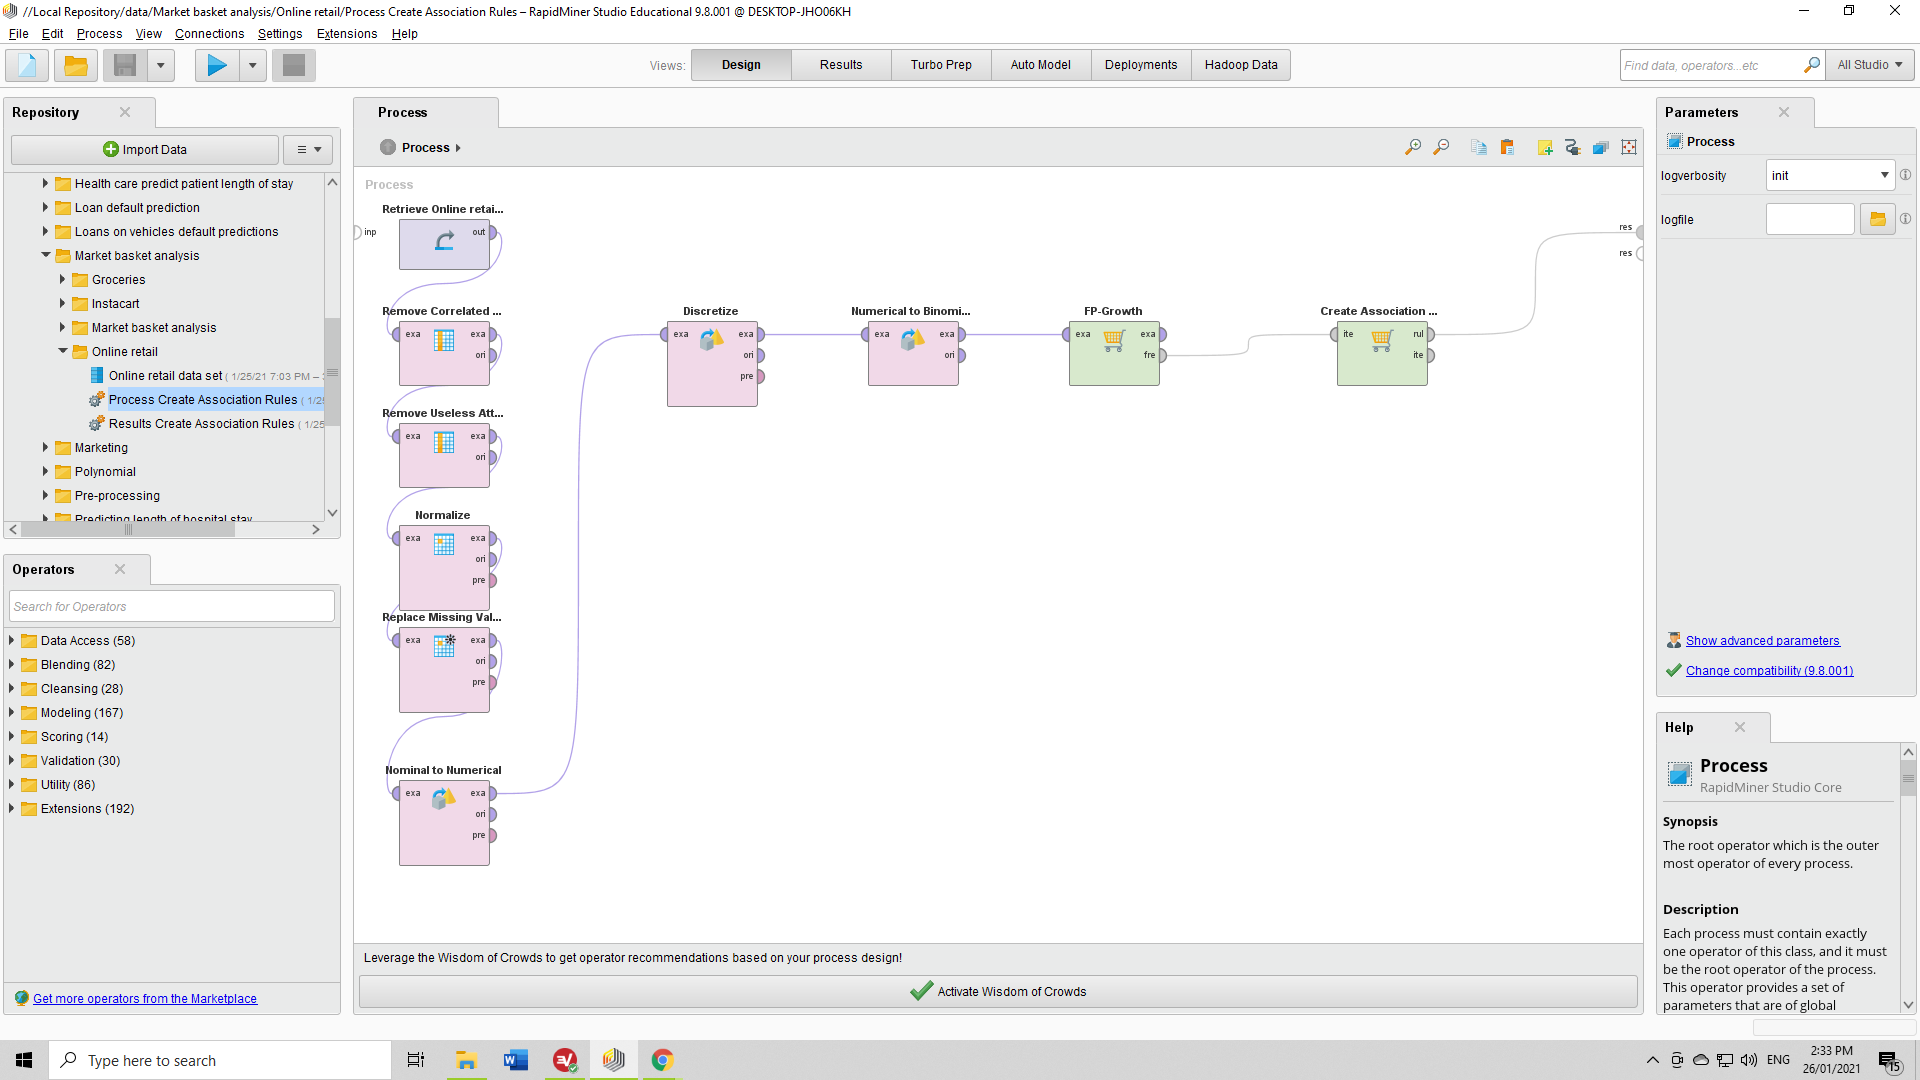
This is my process with operators, Pre-processing to the left, then Discretize, Numerical to binomial, FP-Growth and Create Association Rules.

Executed, this is the process Results. I understand I can click on support, confidence or lift, high to low or low to high, and see different rankings for each row number. What do the different Ranges mean, and is Conclusion the same as Prediction?


This is my process with operators, Pre-processing to the left, then Discretize, Numerical to binomial, FP-Growth and Create Association Rules.

Executed, this is the process Results. I understand I can click on support, confidence or lift, high to low or low to high, and see different rankings for each row number. What do the different Ranges mean, and is Conclusion the same as Prediction?

0
Best Answer
-
 MartinLiebig
Administrator, Moderator, Employee-RapidMiner, RapidMiner Certified Analyst, RapidMiner Certified Expert, University Professor Posts: 3,533
  RM Data Scientist
Hi,you discretized your data. So range1 means the value of the attribute was between -infinity and 0.039.
For conclusion: Somewhat, yes. Its a bit of different nomenclature here. Maybe check out this article: https://community.rapidminer.com/discussion/32107/how-to-interpret-the-results-of-create-association-rules and the linked paper. It explains a lot.Cheers,Martin
- Sr. Director Data Solutions, Altair RapidMiner -
Dortmund, Germany0

 Contributor II